
Homes on the Range: Closing the Southern Tier Household Gap
by Arthur C. Nelson, Ph.D., FAICP
Context
This is the second in a series of articles addressing housing demand in the West to 2030. Readers will note some changes in my analytic methods from the first installment. The focus of this article is on what I call the Southern Tier states in the West, comprised of Arizona, Colorado, New Mexico, Nevada, and Utah (see Figure 1).

Figure 1. Southern Tier States used for the Western Planner Series, Homes on the Range
Source: Map created with https://www.mapchart.net/usa.html
But first, some context. Table 1 shows that between 2020 and 2030, four of these states will be among the nation’s top 10 fastest growing. The Southern Tier is projected to have a growth rate that is twice as fast as the nation, 12.5% compared to 6.2%. Together, these five states are projected to add about 2.7 million residents—more people and at a faster rate of growth than California or Florida. Indeed, only Texas, which ranks 5th in growth rate, will add more people (3.7 million), on a private land base that is 40% larger than that of all the private land among the Southern Tier states combined.
Table 2 shows the growth and growth rates of the metropolitan areas larger than 100,000 persons in 2020. (I exclude smaller metros because a small metro with just a few new developments can skew its growth rate when compared to larger metros.) Of the 23 metro areas, 15 rank among the top quarter of growth rates among the 355 metro areas over 100,000 persons. Four are in top 10 (St. George, Greeley, Provo-Orem, and Phoenix). Indeed, these 23 metropolitan areas will account for nearly all the growth of the Southern Tier, 2.5 million compared to 2.7 million.
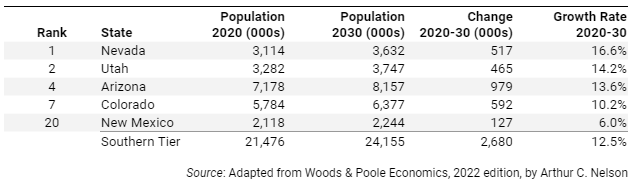
Table 1. Population Change among Southern Tier States Ranked by National Growth Rate
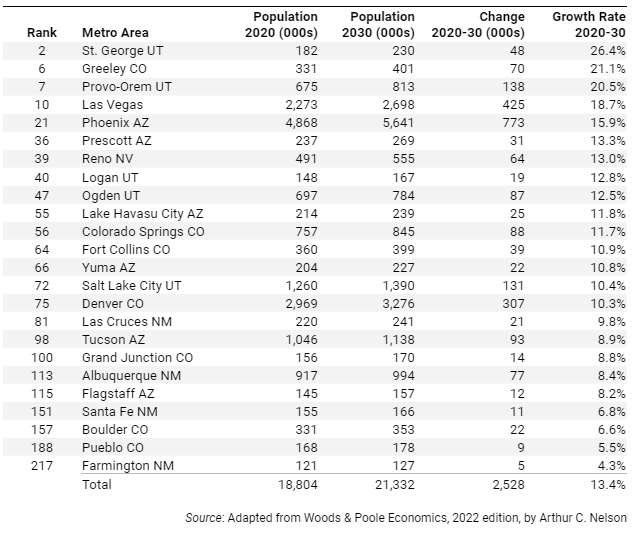
Table 2. Population Change among Southern Tier Metropolitan Areas over 100,000 Persons in 2020
It is from this foundation that I will assess the individual Southern Tier states and their “qualifying” core-based statistical areas (CBSAs) in terms of:
Projecting households and change to 2030, focusing on the shift in households by householder age categories to reflect Starter home demand (householders under 35 years of age), Peak housing demand (householders between 35 and 64 years of age) and Downsizing (householders 65 years of age and older);
Reporting the gap between my estimated household demand and observed households in 2021— I use a method different from that reported in the first installment for reasons I will explain later;
Projecting overall household-based housing needs for the Southern Tier western states and their qualifying CBSAs; and
Addressing the extent to which state level policies are aligned to meet the housing needs of the Southern Tier states—or not.
I use “qualifying” CBSAs because they account for more population agglomerations than metropolitan areas. Simply put, a metropolitan statistical area (MSA) has a central place such as a city of 50,000 or more residents. A micropolitan statistical area (uMSA) has a central place such as a city of between 10,000 and 50,000 persons. (I use the letter “u” as a substitute for the Greek letter mu which the Census Bureau defines as “micro”). In the west, MSAs and uMSAs are comprised of one or more central counties. While MSAs and uMSAs are often merged into combined statistical areas or CSAs, my analysis is of the smaller individual units. Finally, a “qualifying” CBSA is one that had a sufficient sample size to qualify for the American Community Survey (ACS) 1-year survey, meaning that a discrete geographic area such as an MSA or uMSA has at least 65,000 persons.
I worry that the 20th century attitudes toward housing which are especially prevalent in the Southern Tier states are not sufficient to address 21st century housing needs. But there is evidence that this may be changing, in ways I will illustrate later in the article.
Post Baby-Boom Household Trends
Housing demand is driven by households. A household is either a family or non-family group living in a single housing unit, meaning that one household regardless of its size or features equals one occupied housing unit. In this section, I estimate the overall demand for occupied housing units to 2030 for Southern Tier states and qualifying CBSAs. In the next section, I estimate the number of “missing” households using the 2021 ACS 1-year sample. These are households have not formed for want of housing such as young adults returning home from college, young adults who stay home many years into adulthood, couples living as roommates, and so forth. For reasons explained in the second section, I use the 2000 census as the benchmark year. While 2021 was the height of the COVID-19 pandemic, it was also the height of the largest housing boom since the middle 2000s, about 15 years earlier. By comparing the number of households there should be in 2021 based on the headship rates in 2000, I estimate the “household gap.” The third section calculates overall household demand in 2030 based on projections plus missing households in 2021. The final section reviews how states are addressing housing needs and what more can be done.
I noted in the lead article to this series that a very large share of our civic leaders seem to have the view that the future will be like their past. This is very short-sighted thinking with potentially catastrophic implications for housing. This section offers a sobering perspective for the Southern Tier states.
In review, I divide housing demand into three broad groups based on householder age. Those households headed by a person less than 35 years of age are typically looking for Starter homes such as apartments, condominiums, townhouses, and smaller homes on smaller lots. Those between 35 and 64 years of age are at their Peak housing demand stage of life where partners with children and pets want larger homes on larger lots. America became a suburban nation between about 1960 and 1990 as parents of baby boom children born between 1946 and 1964 wanted housing and yard space which is exactly what suburbs provided. For their part, between about 1980 and 2010, boomers sought homes to raise their families in the suburbs they knew. Beginning in 2011, however, boomers began turning 65, which is the age at which I classify householders as Downsizing as they seek smaller homes on smaller lots or attached options. By 2029, all boomers will have entered the Downsizing stage, though certainly this is an over-generalization. Table 3 shows the numerical shift in demand for housing by these three household types for the nation, each of the five Southern Tier states, and the Southern Tier as a whole. Here are the key trends as I see them:
The share of Starter home householders will increase in Arizona and Colorado but stay the same in New Mexico and fall slightly in Nevada from the period 1990-2010 to the period 2010-2030. Utah will see a substantial reduction in share of Starter home households from about a third during the period 1990-2010 to a quarter during the period 2010-2030.
The share of change attributable to Peak housing households will fall dramatically in all states from the period 1990-2010 to 2010-2030. New Mexico will lead the change, falling from 57% to -2%, followed by Arizona from 53% to 9%, Colorado from 60% to 12%, Nevada from 52% to 17%, and Utah from 49% to 31%. The Southern Tier as a whole will see loss of share from 55% to 14% between these periods.
Although less dramatic than national trends where 83% of the net change in households will be among those in the Downsizing category, the Southern Tier share will be 63%, the largest shift in share of any age group. New Mexico, however, would see a 91% share between 2010-2030 followed by Colorado, Arizona, and Nevada at 66%, 65%, and 61% shares, respectively. Utah will lead the nation in having the smallest shift in share at 43%, which is still more than twice the share of 19% during the period 1990-2010.
I do not know many elected officials who understand the implications of America’s aging households on housing markets generally or their own communities. This series of articles in The Western Planner may give local planners and other professionals they need to inform elected officials of the monumental change to come. This will be aided by tables 4 through 8 that report estimates of household change by householder age for each of the Southern Tier states and their qualifying CBSAs. I invite readers to study these data more carefully for trends applicable to CBSAs of interest to them. Here are the topline results for qualifying CBSAs in each state:
In Arizona (Table 4), except for Phoenix and with a small nod to Yuma, I estimate that all metropolitan areas will lose Peak housing demand households between 2010 and 2030 with much of the occurring in the present decade. In those MSAs, however, Peak housing demand will account for only 16% and 18% of the new housing demand, respectively. This is in stark contrast to the period 1990 to 2010 where those households dominated new housing demand. Moreover, all or more than all (as in more than 100%) of the change in housing demand will be among Downsizing households in Lake Havasu City (100%), Prescott (102%), Show Low (114%) and Sierra Vista (114%). In all qualifying CBSAs, Downsizing households will account for the largest share of change in demand especially during the 2020s. While Peak housing demand households are in decline and Downsizing households are in ascendancy, Starter home households may be squeezed between Downsizing households who don’t sell their homes likely because there is an insufficient supply of smaller homes in which to move, and there would be more Downsizing households in every qualifying CBSA trying to unload their larger homes than Starter home households, especially since there would be no demand among Peak housing demand households for them anyway. Conversely, the rest of the state is expected to see an increase in Peak housing demand households, such as the smaller uMSAs including Nogales among others, and Indian nations.
Table 5 shows projections for Colorado that are quite different. While nearly all qualifying CBSAs will add Peak housing households, their share will be much smaller than during the period 1990-2010 while still trending upward. Unlike projections for Arizona, there will be some market for Downsizing households selling off their homes to new Peak housing households and perhaps some Starter home households. However, on the whole, there will be three new Downsizing households for every two new Peak housing and Starter home household.
Qualifying CBSAs in Nevada (Table 6) will exhibit trends roughly similar to Colorado.
Trends in New Mexico (Table 7) will be more like Arizona than Colorado or Nevada.
The true outlier in the Southern Tier, as well as the nation, is Utah where the change in Starter and Peak housing households will exceed that of Downsizing households through the 2020s. Two reasons are the state’s high birth rate compared to the nation as well as in-migration of new workers from other states. Nonetheless, compared to the period 1990 to 2010, the next period will witness substantial shifts in demand away from Starter and Peak housing households to Downsizing ones, especially in the Ogden, Salt Lake City, and St. George MSAs.
Tables 4 through 8 provide planners and policymakers in each of the Southern Tier states and the qualifying CBSAs with guidance on the nature of change in housing demand between 2010 and 2030. Indeed, that change has been accelerating since 2010 and will not plateau until boomers begin passing away in large numbers starting in the 2030s. For the rest of this decade and well into the next, Downsizing households will dominate the nearly all the markets and, in some cases, will be the only source of the change in housing demand.
In several metropolitan areas in the Southern Tier, Downsizing households will constitute all the change in households by householder age; that is, the entire change in households with householders 65 years of age of older between 2010 and 2030 will be due to those households either moving into these metros or aging out of the Peak housing group into the Downsizing group. Accordingly, these are the highest risk metropolitan areas for housing stress which is often also associated with economic and social service stress. As a benchmark, any qualifying CBSA where Downsizing households are projected to account for at least three quarters of the net change in households is considered at risk for not being able to meet emerging housing needs. I suspect this is a conservative figure; half or more might be more realistic. Those qualifying CBSAs, with none being in Utah, are listed below in alphabetical order:
Arizona
Lake Havasu City, MSA
Prescott, MSA
Show Low, uMSA
Sierra Vista, MSA
Tucson, MSA
Colorado
Boulder, MSA
Glenwood Springs, uMSA
Grand Junction, MSA
Pueblo, MSA
Nevada
Carson City, MSA
New Mexico
Alamogordo, uMSA
Albuquerque, MSA
Farmington, MSA
Gallup, uMSA
Santa Fe, MSA
I will next present estimates of the household gap in 2021 for the Southern Tier states and qualifying CBSAs.
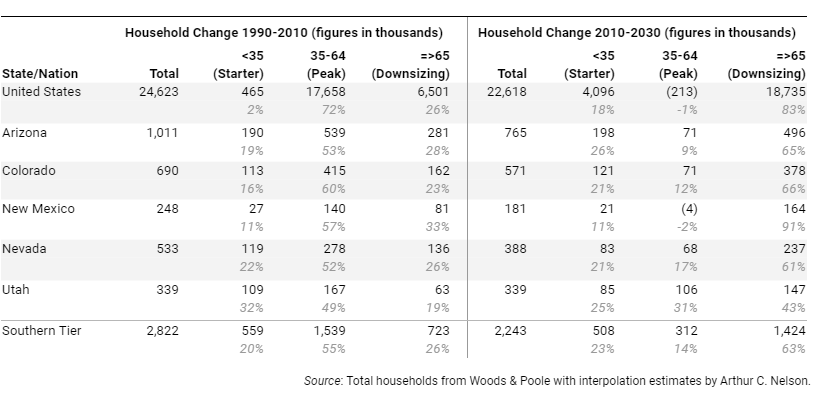
Table 3. Change in Share of Housing Demand 1990-2010 and 2010-2030 for the Nation, Western States, and Southern Tier
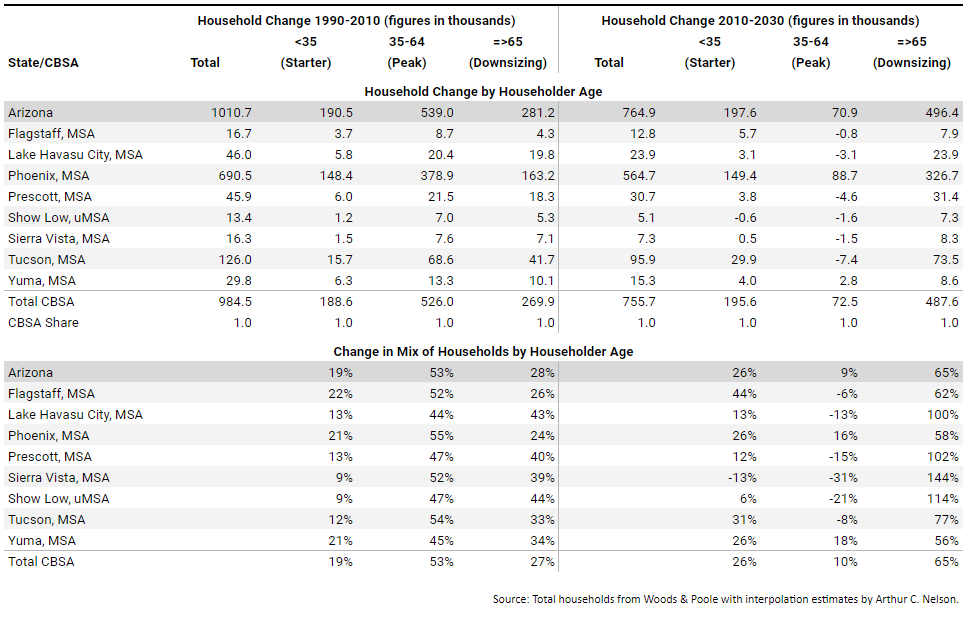
Table 4. Change in Share of Housing Demand 1990-2010 and 2010-2030 for Arizona and Qualifying Core-Based Statistical Areas (CBSAs)
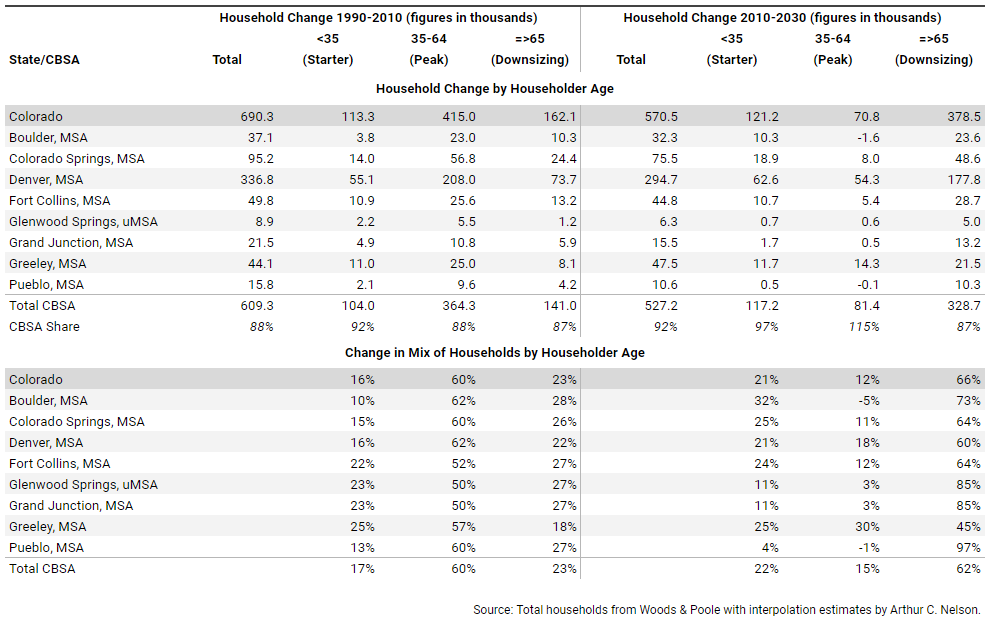
Table 5. Change in Share of Housing Demand 1990-2010 and 2010-2030 for Colorado Qualifying Core-Based Statistical Areas (CBSAs)
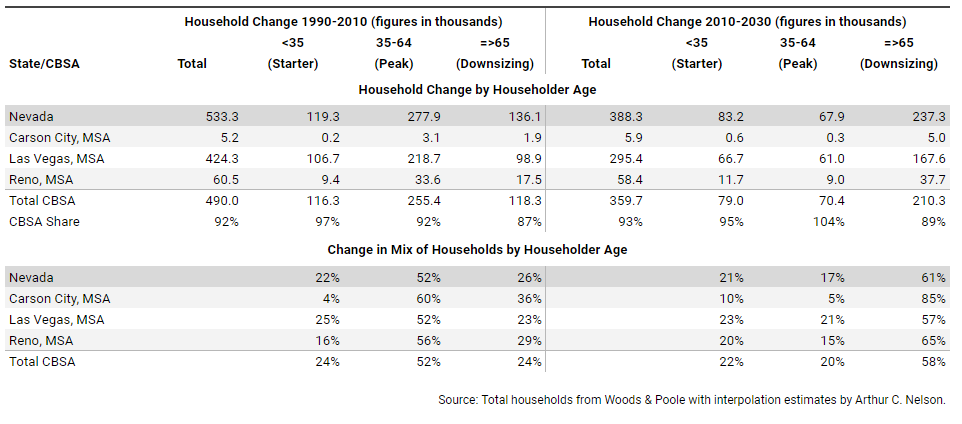
Table 6. Change in Share of Housing Demand 1990-2010 and 2010-2030 for Nevada and Qualifying Core-Based Statistical Areas (CBSAs)
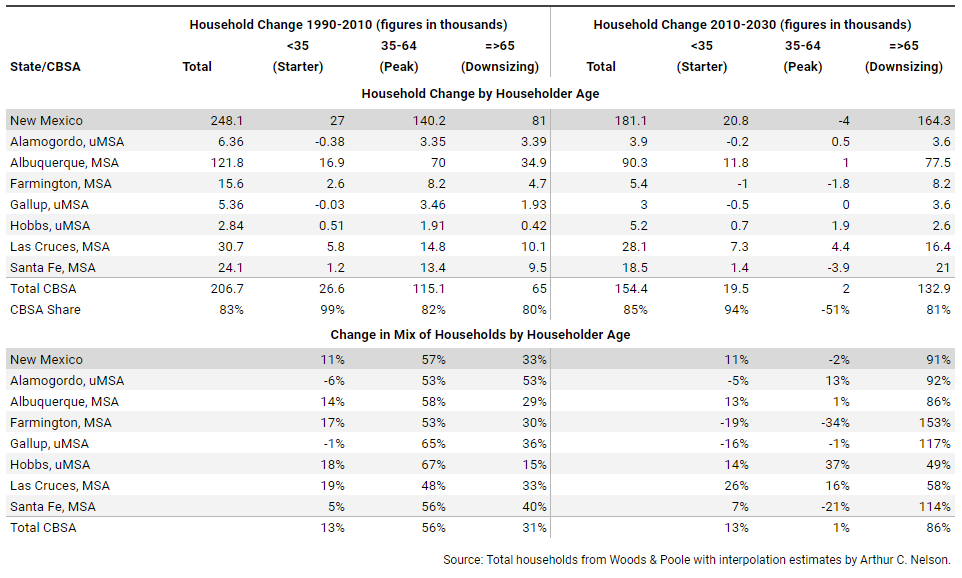
Table 7. Change in Share of Housing Demand 1990-2010 and 2010-2030 for New Mexico and Qualifying Core-Based Statistical Areas (CBSAs)

Table 8. Change in Share of Housing Demand 1990-2010 and 2010-2030 for Utah and Qualifying Core-Based Statistical Areas (CBSAs)
The Southern Tier Household Gap in 2021
In the opening article of this series, I noted that the nation arguably produced more housing than needed to meet market demand during the 2000s, which led in part to the Great Recession (GR) of 2007-09. Since then, production faltered from the period 2012, after the GR, to 2019, before the COVID-19 pandemic. The first article used Up for Growth’s Housing Underproduction data to estimate housing units missing from the inventory of homes in 2019 (see https://upforgrowth.org/apply-the-vision/housing-underproduction/). Using 2021 ACS data and revisiting the methodology used by Up for Growth, I calculate simply “missing” households and do not adjust for vacant or uninhabitable units. Also, unlike Up for Growth which bases its analysis on PUMAs (public use micro-sample areas) for units of 100,000 persons to achieve full geographic coverage of the nation while sacrificing geographic fidelity with CBSAs, I sacrifice full coverage for calculating the household gap for qualifying CBSAs.
The Household Gap calculation is as follows:
Household Gap =
Headship rates between 15 and 44 years of age, and more 45 years of age or older from the 2000 Census, where headship rate is calculated as the number of householders within each age cohort divided by the number of persons also within each age cohort, times the number of persons within each age cohort from the 2021 ACS. The younger age cohort captures the missing households from the Up for Growth Housing Underproduction study while the older age cohort adds to it.
This calculation is done for each county within each CBSA based on the Census 2021 CBSA geographies, and then summed to each CBSA. It is also done for each state. Table 9 reports results for the Southern Tier states and their qualifying CBSAs.
The method assumes that the year 2000 reflected “normal” household formations in the absence of economic, social, or other turmoil. It also assumes constant headship rates by householder age with respect to race, ethnicity, and income over time, among other factors. While obviously not strictly true, the Census for 2000 was indeed a year at the end of a decade mostly devoid of economic, social, and other turmoil. Moreover, household incomes by race, ethnicity, and age have not changed much (unfortunately) between 2000 and 2021. Nonetheless, future work will focus on making more refined headship estimates that will be applied to more refined cohort data accounting especially for race and ethnicity. While readers can study these data for their own particular purposes, my focus here is on the larger picture.
Arizona
Arizona was “missing” about 115,000 households in 2021, meaning that about 115,000 households were not formed because they were doubling up with others in the same housing unit. Nearly all those missing households are from the Phoenix MSA, about 106,000. Indeed, all the other Arizona qualifying CBSAs are very close to their household expectations if not slightly more.
Colorado
Colorado’s household gap is less than half that of Arizona, at about 45,000, despite being just a third less populated. The largest MSA, Denver, was missing 31,000 households, or less than a third of what Phoenix was missing, even though Phoenix has 50% more people.
Nevada
On a percentage basis, Nevada’s household gap is about twice that of Arizona’s, given that its population is less than half while its missing households numbered more than 90,000. Two-thirds of this gap is located, not surprisingly, in the Las Vegas MSA which accounts for about two-thirds of the state’s population.
New Mexico
New Mexico fares best among the Southern Tier states with a gap of less than 6,000, or just 1% of the households existing in 2021. The three uMSAs have household gaps higher than 10% but they are also small and slow growing.
Utah
On a percentage basis, Utah has the second highest household gap at 5% compared to Nevada’s 7%, equating to about 52,000 missing households. The Salt Lake City and Ogden MSAs accounted for about half of the shortfall, at 26,000.
At first blush, these figures seem small, being around 4% for the Southern Tier. But they are not trivial, adding up to more than 300,000 missing households or the equivalent to four-fifths of the households in the Albuquerque metropolitan area. For perspective, this is equivalent to nearly three years of new housing construction in all the Southern Tier states The magnitude of what is needed to close the household gap is the topic of the third section.
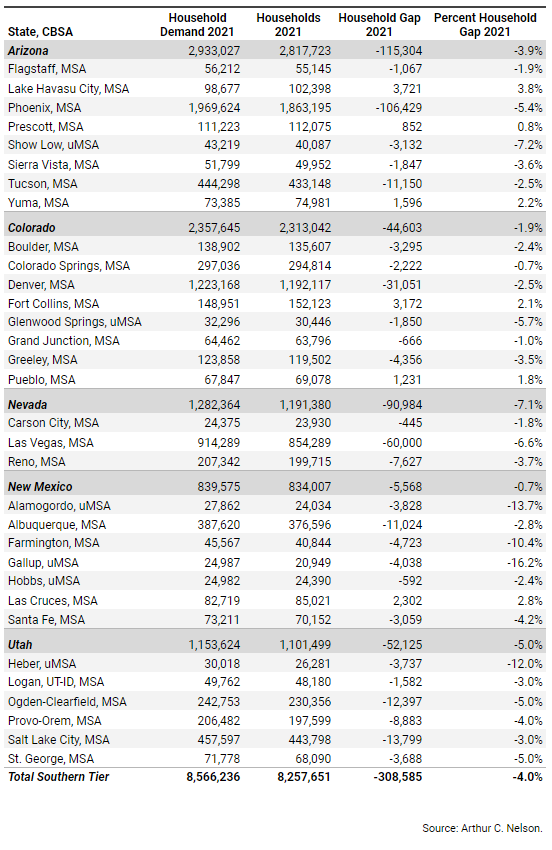
Table 9. Household Gap for the Nation, Southern Tier States, and Qualified Southern Tier CBSAs, 2021
New Homes Needed on the Range in the Southern Tier between 2021 and 2030
Planning is all about anticipating needs and choreographing the resources to meet them, consistent with what the smart planning goals I outlined in the first article of this series. In this section, I project total new households for the Southern Tier and its qualified CBSAs. This is equivalent to estimating the need for occupied housing units since one household equals one occupied dwelling unit.
Table 10 reports the total household projected for 2030 by Woods & Poole Economics, the number of households existing in 2021 from the ACS, the number of new occupied housing units needed between 2021 and 2030, and the percent of those new units relative to households existing in 2021. These figures do not include the need for vacant units, units not available for occupancy, or other types of units that are not occupied. In resort areas, further adjustments are needed to address seasonal housing for both seasonal residents and the seasonal labor force. This figure does not include housing units that are lost because of disasters (such as floods and fires) or demolition to make way for redevelopment. I am engaged in research that will try to estimate this in future publications. As a rule of thumb, four tenths of one percent of the housing stock more than 10 years of age is lost, so over the period 2021 to 2030 the equivalent of about 4.0% of the stock existing in 2020 would need to be added to the new dwelling unit demand. For now, I will be conservative because we are unlikely to meet the figures reported in Table 10,
While I will leave it to readers to assess the implications of Table 10 on areas of their interest, key overall findings are:
More than 1.0 million new households should be expected in the Southern Tier states who would occupy dwelling units if given a chance. This is roughly 13% more households than existed in 2021. It includes “missing” households.
Arizona will account for about a third of the new household demand followed by Colorado at about a quarter, Nevada at about a fifth, New Mexico at about a sixth, and Utah at about an eighth.
By itself, the Phoenix MSA will account for nearly 25% of the new household demand with Los Angeles and Denver comprising about 15% and 11% each, respectively. While none of the four largest Utah MSAs will account for more than about 3% of the Southern Tier’s share of new household demand, collectively they comprise 9%.
Except for the largest CBSAs noted above, most will see their household demand grow by 10% between 2021 and 2030, though one (Glenwood Springs, CO uMSA) is expected to fall.
More than one million new households will need to occupy homes between 2021 and 2030, which is a very large yet manageable challenge. For instance, if something on the order of one quarter of all homes over 2,000 square feet added an accessory dwelling unit (ADU) during this period, I estimate that we could meet household demand for dwelling units by 2030. After all, given the demographic trends presented in the first section, there will be a decline in Peak housing households with the largest share of change among Downsizing households and a smaller share among Starter home households. Figure 2 illustrates the nature of the housing needs of households to 2030 and beyond.
Considering the nature of change in housing demand based on demographic shifts, the market might deliver these and related kinds of units ADUs if regulatory and financial institutions can be made more accommodating. That is the topic of the last section.
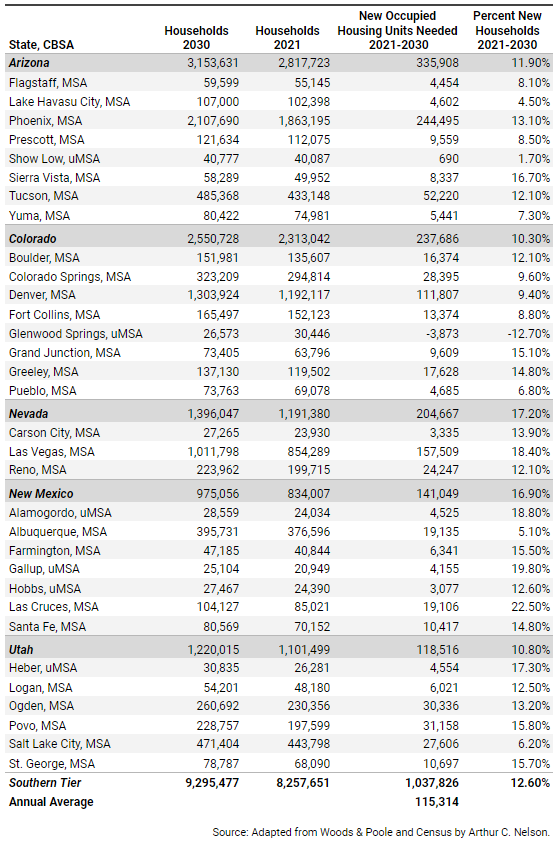
Table 10. Household Change in the Southern Tier States and Qualified Southern Tier CBSAs, 2021-2030
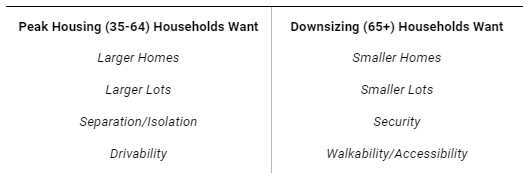
Figure 2. What Peak and Downsizing households want for their homes and communities
Note: 65+ means householders who are 65 years of age or older.
Rising to the Challenge in the Southern Tier
Western states are not alone in granting deference to local governments through calls for “local control” and “home rule” and such. It is as if every community is for itself and every citizen is for themself, creating a bedrock of chauvinism and civic discrimination that is difficult to overcome. As I noted in the lead article, this leads to exclusionary zoning; NIMBYism (not-in-my-backyard); protracted review processes; development mitigations (“exactions”) that exceed impact (“inefficient” mitigation); high permit, connection, and other fees; antiquated building codes; and so forth. These and other mostly local barriers constrain the formation of households, so they go missing in America’s housing markets. While many public officials perceive the outcome of housing barriers is fewer housing units, what they do not know is the number of households that are missing from communities because of them. After all, for more than two centuries, the formation of households has been a foundation of American society. I hope that the analysis presented in this article can help rekindle public officials’ commitment to this American ideal.
I have come to the conclusion that meeting housing needs cannot be left solely to local government. Frankly, when left to their own devices most (although not all) local governments act in their own self-interest, which typically winds up perpetuating the conditions that lead to housing underproduction presented by Up for Growth, and the household gap presented in this article.
State legislatures in the Southern Tier are not oblivious to the need for an increase in housing supply. Indeed, all states enable and some even require local governments to prepare comprehensive plans that address housing needs. As the old saying goes, however, those plans often gather dust on the shelf regardless of their rigor, merits, wisdom, or cost. There are exceptions of course, but they tend to prove the rule. One exception is Flagstaff, Arizona, which is highlighted below. In response to the growing need to expand housing supply in the face of local government recalcitrance, efforts by two states to expand housing in single family residential zones will also be highlighted: Arizona and Utah. Finally, a novel approach approved by Colorado voters in November 2022 will be reviewed.
Focus on Flagstaff
One local government exception worth noting is Flagstaff. Between 2000 and 2020, Flagstaff’s population grew by 47% on a land base that is constrained by geography and public land holdings. At just 1.9%, it also has among the lowest household gaps in the Southern Tier. This is no accident. As the home of Northern Arizona University, it needs to accommodate a large student population as well as thousands of lower-middle to middle-income university workers and those whose jobs depend on the university population. For these and other reasons, since the middle 2000s, the city has been innovative in meeting housing needs by relying mostly on the private sector. Without being exhaustive, Flagstaff uses such tools as:
Allowing detached, attached, and integral accessory dwelling units (ADUs) in all zones with existing single-family dwelling units. For lots under 6,000 square feet, ADUs must be integral to the principal unit. For lots more than 6,000 square feet, detached ADUs are allowed. Moreover, water capacity fees are waived thus saving property owners who create ADUs more than $9,000 in cash outlay. My interpretation of this policy is that ADUs (a) reduce the need to build more homes on other lots farther out thereby saving the City the cost of utility extensions, (b) reduce demand for lawn irrigation, and (c) will often “rebalance” the number of people living on the property given that average household size has dropped every decade, perhaps plateauing at the current (2020) level.
Allowing duplexes and multifamily units outright in all residential districts except “single family residential neighborhood” which applies substantially to subdivisions in certain areas of the city. The number of attached units is calculated based on the zoning density. For instance, if the underlying zoning allows for six units per acre, they can all be attached as townhouses on individual lots (after platting) or any configuration of multi-family structures subject to setback, height, and other conventional restrictions. This is especially useful when large shares of a lot are too steep or in other ways not suitable for development as detached housing.
A density bonus program for projects meeting affordable housing requirements.
The city has other tools as well and is continually experimenting with new approaches and refining existing regulations to facilitate more residential options. The bottom line is that in terms of meeting market demand for housing, Flagstaff’s innovating and flexible approach seems to be effective.
Focus on Arizona
In 2022, the Republican-dominated Arizona legislature was poised to adopt HB 2674 which, among other provisions, would have overridden local zoning ordinances to allow up to 8 dwelling units per acre on any land zoned for single-family uses. That bill was amended and adopted to create a “Housing Supply Study Committee” instead. It is comprised of legislators, local government officials, and representatives from housing interests, among others. The committee is required to make recommendations for legislative changes by the end of 2022 with the expectation that the state will intervene to override local zoning constraints in single family detached districts during its 2023 session.
Focus on Utah
While California and Oregon have considerably expanded housing options in single family residential districts (reviewed in the fourth and fifth installments, respectively), neither goes as far as Utah in making accessory dwelling units (ADUs) by-right in a manner that supersedes covenants, conditions, and restrictions (CC&Rs) of title and homeowner association (HOA) approval (aka denial).
In 2021, the Republican-dominated Utah State Legislature passed H.B. 82 which requires cities and counties to allow ADUs as a permitted use in single family zoning districts if they are internal to the primary structures. Thus, the term “internal accessory dwelling unit” or “IADU” has become part of planning and development lexicon in Utah. This law does not extend to mobile homes, however. Cities and counties have the option to restrict lot sizes to more than 6,000 square feet and add an additional parking pad to the lot. Cities also have the option to prohibit IADUs in up to 25% of the total area zoned for residential uses, or up to 67% if a university is in the city and has a student population of 10,000 or more. Still, this is milestone legislation that the rest of the nation should follow.
The legislature considered but deferred extending this right to conversions of detached garages with apartments above, other detached structures, tiny homes, and so forth. It has also created mandates and incentives to expand the supply of housing that is affordable to larger shares of households.
Focus on Colorado
By a margin of 53% in favor and 47% opposed, Colorado voters passed Initiative 123 in November 2022to use state income tax funds for affordable housing. Colorado is the only state with this kind of state level, taxpayer-driven approach. Its key features include:
Providing grants to local governments and loans to nonprofit organizations to develop affordable housing;
Creating an “affordable housing equity program” to leverage equity investments in multifamily rental housing units ensuring that rent does not exceed 30% of a household's income;
Creating a program to provide debt financing for low- and middle-income multi-family rental developments and existing affordable housing projects;
Creating an affordable home ownership program that provides down-payment assistance for qualifying homebuyers;
Creating a grant program for local governments to increase capacity to process development applications for housing projects; and
Creating a program to provide rental assistance, housing vouchers, case management and other services for homeless households.
The initiative is expected to generate up to $300 million annually to expand the supply of affordable housing. In all, the initiative is estimated to create about 170,000 affordable housing units over two decades. However, funds go only to communities that have state approved policies showing a commitment to expand affordable housing locally, including a commitment to increase local affordable housing stock by 3% each year. Communities are not required to participate in the program.
Perspectives About the Southern Tier Going Forward
The reason I noted that two Republican-dominated legislatures have either adopted (Utah) or seem poised to adopt (Arizona) sweeping changes to by-right residential options in single family zoning districts is that this trend seems to be bipartisan. In the Northwest and California installments, I will show that Democrat-dominated legislatures are doing the same. It seems that in many western states, legislatures are coming to grips with their role in advancing the well-being of their citizens statewide by expanding housing choices everywhere, even if it means overriding local control over housing decisions.
The next installment of this series will focus on the Northern Tier states of Idaho, Montana, North and South Dakota, and Wyoming.
About the Series Author
Arthur C. Nelson, Ph.D., FAICP, is Professor Emeritus of Urban Planning and Real Estate Development at the University of Arizona where he designed an online Master of Real Estate Development program that has become the nation’s top-rated and most diverse graduate real estate degree opportunity. He is also Presidential Professor Emeritus of City & Metropolitan Planning at the University of Utah where he was founding director of the Metropolitan Research Center and the Master of Real Estate Development Program. Nelson is from Oregon and has engaged in professional practice or research in all the conterminous western states. He is the author of more than 20 books, more than 400 other publications, and has been a principal investigator or Co-PI of more than $50 million in grants and contracts.
©2022 by Arthur C. Nelson. All rights reserved.