
Solar Power Expands Across the West: Potential Development Impacts and How to Respond

FIGURE 1: Analysts expect pricing in all PV markets to continue to decrease in the long term. The 2020 price projections are approximately half of what the same analysts projected 5-10 years ago. Source: Sun Shot, U.S. Department of Energy “Photovoltaic System Pricing Trends: Historical, Recent, and Near‐Term Projections, 2014 Edition.” Read the entire report at http://www.nrel.gov/docs/fy14osti/62558.pdf.
by Scott Harmstead, AICP, Bismark, North Dakota
This article was first published in the February / March 2015 issue of the Western Planner.
While many Western planners already deal with land use regulation for utility-scale solar power facilities, there remain areas in the West where solar has yet to become an important component of utility-solar power generation. Using first-hand experience in the public and private sectors, the article highlights common impacts encountered in regulating utility-scale solar power facilities and offers solutions.
Continued Expansion in the West
Many planning practitioners across the West know about utility-scale solar facilities. Many have dealt with solar facility regulation in local plans and codes. However, there are areas in the West that remain relatively untouched by the solar frenzy that began almost a decade ago in states like Nevada, Arizona, and California. Other states that may have plentiful sun still rely on other cheap and plentiful energy sources - such as coal, wind, or natural gas. Examples of these states include Wyoming, North Dakota, and Montana. However, regulatory changes and economics are starting to make solar facilities become likely players in wind and fossil fuel-rich states.
The Environmental Protection Agency’s (EPA) Clean Power Plan rule allows states different options to meet new carbon emission rate goals—some of these options include the addition of renewable power sources such as solar power. The other, much bigger factor driving a wider interest in solar is the drop in prices. According to the U.S. Department of Energy,1 utility ground-mounted solar facility prices fell 16-19 percent per year between 2009 and 2013. As shown in Figure 1 below, the fall in prices is expected to continue over the long term.
Utility-Scale Solar
Generally, there are two types of utility-scale solar facilities that produce power on a large scale straight into the grid. Concentrated solar power (CSP) utilizes a system of lenses or mirrors and a unified tracking system to focus sunlight into a beam. The concentrated heat created by the mirrors are used to heat a medium, such as water or oil that in turn works a generator to create power. A recent example is the Invanpah Solar Electric Generating facility in California, with a generating capacity of 377 megawatts.2 The other more common type is photovoltaic (PV). PVs utilize solar cells to convert light into energy. Unlike concentrated solar power, a medium such as water is not necessary. PVs are the more common type of solar power system in use today for both utility-scale use and residential or commercial use. Utility-scale PV facilities are the subject of this article.
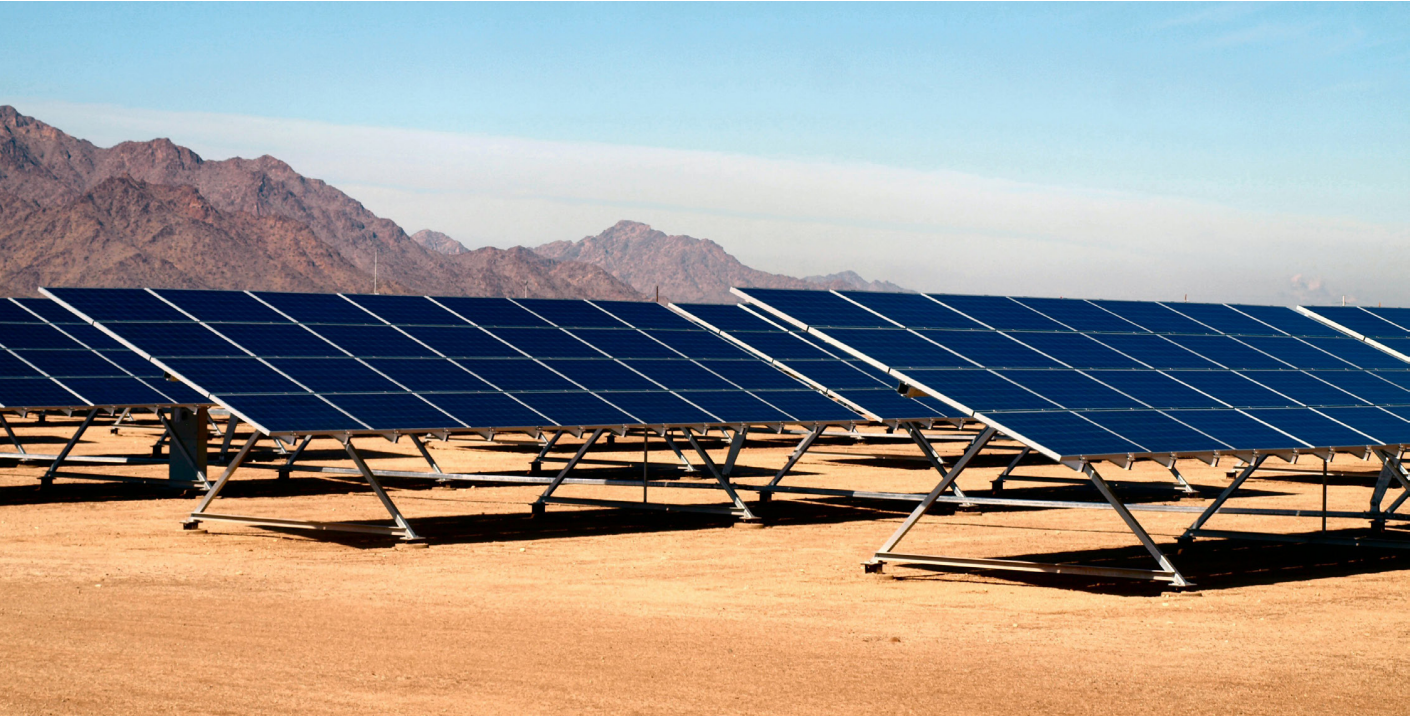
COTTON CENTER SOLAR PLANT. Arizona Public Service (APS) is the state’s largest and longest-serving electric company, with more than 1.1 million retail and residential customers in 11 of the 15 counties. The company anticipates that Arizona’s energy needs will be 50 percent higher by 2025. To meet 65 percent of that growth in demand, APS is focused on energy efficiency and increasing the amount of renewable energy in its generation portfolio. Over the next 15-20 years, APS expects to add more than 1,600 megawatts of renewable resources - enough to power 400,000 homes. As part of its renewable energy investments, APS brought the 17-megawatt Cotton Center Solar Plant, above, and two additional plants online in 2011. The Cotton Center Solar Plant is located on 145 acres near Gila Bend, Arizona and consists of more than 93,000 photovoltaic panels placed in 1,662 rows. Photo by Cyndi Eisenberger.
Impacts of Utility-Scale PV Facilities
ISSUE: AESTHETICS
Solar facilities most resemble an industrial use. Rows of metal and glass are typically not appropriate within the corridor of a scenic highway. If located adjacent to an existing residential area, the neighbors may not think too highly of a project that converts what may have been open greenery into walls of metal and glass surrounded by chain link fence.
THE SOLUTION
The first contact with a potential applicant should convey the importance of siting a utility-scale solar facility. The best way to minimize aesthetic impacts is to minimize the chance solar facilities will be seen by the public. That means siting in deserted areas, areas that already look degraded or industrial in nature, and areas away from scenic highways—in other words places where the public will not notice the change to the aesthetic environment. If the applicant is resolute in placing a solar facility adjacent to residences or a scenic route, the next step would be to consider screening. Given the rural setting of most solar facilities, vegetative screening is usually most preferred given the surrounding character. The problem, of course, is the time it takes for the vegetation to grow up and screen the facility. In the end, screening can never completely eliminate the visual impact—once open fields and unimpeded viewsheds will be changed.
ISSUE: GLARE
Photovoltaic panels are designed to absorb sunlight, not reflect it. PV solar facilities are increasingly utilizing tracking bases to make sure the PV cells are always oriented to absorb sunlight at the most optimal angles. The panels are typically angled upwards toward the sun, usually in a direction away from motorists or building windows. Reflectivity can be measured by albedo, which varies between 0 (no light reflected) and 1 (a mirror-like surface). Solar panels with at least one layer of anti-reflective coating (most panels are designed with at least one layer) have a reflectivity of around 0.10. Compare this to agricultural vegetation, which has an albedo between 0.18 and 0.25. One environmental assessment notes that aircraft flying over an array near an airport “may momentarily experience direct glare from the solar array, but the reflection intensity from the panels is only half compared to agricultural vegetation.”3 Environmental assessments already approved for PV solar facilities are a good resource to find factual information on the impacts of glare.
THE SOLUTION
The solution for the issue of glare with PV solar facilities is education. Facts about glare should be presented by staff as objectively as possible, utilizing studies and other documentation already performed through existing environmental assessments and other trustworthy sources.
ISSUE: WILDLIFE
Sometimes, what looks like vacant, sparse land could be valuable habitat for a number of species of wildlife. The Invanpah Solar Facility displaced desert tortoise habitat in California and involved the relocation of tortoises from the project area to another location.4 However, impacts to wildlife are not always as clear-cut as a direct loss of habitat. Even projects located adjacent to certain types of habitat can have a potential impact on wildlife. For example, regarding another project in California, an environmental group commented that a project located on agricultural land adjacent to a riparian area would have an impact upon an endangered hawk.5 The agricultural land, where the project was proposed, was claimed to supply valuable foraging habitat for the hawk. The passage of wildlife can be a concern—utility-scale solar facilities are typically fenced for security reasons. Unfortunately, a fenced site, especially of the large size common to many solar facilities (about 10 acres per megawatt), can become a major obstacle to wildlife and would impact foraging wildlife similarly as if the entire fenced site were a large building.
THE SOLUTION
Here is another impact where siting can help immensely. Identify a proposal’s proximity to critical habitat areas early. Do not simply verify if there may be direct impacts to critical habitat, but also evaluate the project’s proximity to critical habitat and potential impact to foraging opportunities and the general passage of wildlife from one habitat area to another. Just because a project is located on land that has been in agricultural production for decades does not mean the project will be free of impacts to wildlife. Habitat and foraging area information can be gathered from a number of sources and may require some outreach on the planner’s part. Important sources to reach out to include the U.S. Fish and Wildlife Service and the state’s wildlife agency. Areas with other development pressures may have helpful documents, such as Habitat Conservation Plans, project-specific biological assessments, and related documentation that will help identify critical habitat areas and wildlife behavior.
ISSUE: FARMLAND
Coincidentally, both utility-scale solar facilities and farmland operate best on relatively level, open ground. Many places that are ideal for utility-scale solar facilities are utilized as active farmland. In many places, viable farmland is at a premium. Across the West, viable farmland may include areas with access to irrigation and/or areas that include U.S. Department of Agriculture designated prime or unique farmland.
THE SOLUTION
Once again, siting is important to protect exceptional farmland. Even though utility-scale solar facilities should be accompanied with reclamation plans that ensure the land is returned to its natural or previous state after the life of the solar facility, exceptional farmland is at a premium in many places and protection should be considered from solar facility development. A mapping analysis to identify prime and unique farmlands, or even viable farm areas with access to irrigation, helps in this instance to avoid important agricultural areas with a high productive capacity.
The Solution is in Siting
If possible, set siting standards early, before applicants come to the permit counter. Be proactive by identifying the following critical elements through a GIS mapping analysis:
Existing and planned transmission corridors capable of supporting utility-scale power generation
Prime, unique and other valuable farmlands that are particularly important to the community or region
Critical habitat areas and important foraging and migration areas
Scenic highway corridors
Areas with existing residential development
Areas planned for other types of development in existing local plans
• Known areas of historical or cultural importance
To assist in this effort, reach out to state and federal agencies for input and information. As constrained areas are identified, areas available for utility-solar facilities become apparent. Developers will appreciate such guidance by giving them certainty and requiring less leg-work in finding areas acceptable for solar development.
Implementation Tools
Once constrained areas have been mapped, update the comprehensive plan and amend the ordinance/code to protect those areas. Areas of solar power opportunity may be translated into a mapped overlay zoning district. Many communities have utilized this approach in a number of ways. Massachusetts has a widely utilized model zone for utility-scale solar6 that can be utilized as an overlay zone in local jurisdictions. The State of Washington passed Senate Bill 5107 in 2009 to encourage local jurisdictions to create local overlay zones that provide suitable solar sites with available infrastructure and also protect environmentally sensitive areas.7 Klickitat County in south-central Washington conducted a detailed environmental analysis8 prior to establishing their own energy overlay zone that involves solar, gas-fired, biomass, and wind power. Areas covered by an overlay zone may allow solar projects by right, subject to a number of standards - such as a reclamation plan, setback provisions, or operation and maintenance provisions (in addition to compliance with state and federal requirements). The University of Arizona recently developed a statewide suitability analysis for utility-scale solar facilities for planners, as described in the Dec. 2014-Jan. 2015 issue of The Western Planner. An interactive Arizona map of low to highly suitable areas can be found at http://reoa.uagist.com.
Alternatively, solar projects may be allowed on a project-by-project basis. In this case, the areas mapped as constrained would be referenced in the ordinance language and utilized when evaluating the placement of each development proposal. In such instances, a conditional use permit may be utilized, or an individual overlay zone application. In either case, the application should come with standards to ensure environmental protections, reclamation, and other concerns are taken into account.
During a recent zoning ordinance update meeting in Beulah, North Dakota, utility-scale solar power was identified by a local engineer as a very likely future land use. Ironically, Beulah is a city economically dependent upon coal mining and energy production. This comment from a coal town was a result of the EPA’s recent Clean Power Plan—a new federal rule that may be opening the door to solar power in states across the west that have yet to experience utility-scale solar facility development. With solar development set to expand, it will be imperative for local planners to understand the full spectrum of impacts and be prepared to thoughtfully regulate solar facilities.
About the Author (at the time of publication)
Scott Harmstead, AICP, is an Associate Planner with SRF Consulting Group, Inc. He has over eight years of diverse experience in the land use planning and zoning field. He most commonly works with city and county governments to develop comprehensive and other long range plans and zoning code updates.
ENDNOTES
1. U.S. Department of Energy SunShot, Photovoltaic System Pricing Trends. http://www.nrel.gov/docs/fy14osti/62558.pdf
2. http://www.ivanpahsolar.com/
3. Cluster I Solar Power Project, Final Environmental Impact Report, Appendix J, June 2012, Imperial County CA
4. Bloomberg Businessweek. Where Tortoises and Solar Power Don’t Mix. http://www.businessweek.com/articles/2012-10-04/where-tortoises-and-solar-power-dont-mix
5. Adera Solar Project, Initial Study and Mitigated Negative Declaration, Exhibit M, August 18, 2011, Madera County CA.
6. State of Massachusetts Department of Energy Resources, Model Zoning for the Regulation of Solar Energy Systems. http://www.mass.gov/eea/docs/doer/green-communities/grant-program/model-solar-zoning.pdf
7. State of Washington Department of Commerce, Energy Overlay Zones – A Report Prepared to Support the 2010/2012 State Energy Strategy. http://www.commerce.wa.gov/Documents/GMS-Energy-Overlay-Zones-Final-Brief.pdf
8. Klickitat County Energy Overlay, Final Environmental Impact Statement, September 2004, Klickitat County, WA.
SRF CONSULTING GROUP
Since 1961, SRF Consulting Group is a 100 percent employee owned company, working with its clients to create vibrant, livable communities and sustainable transportation systems. SRF now has offices in Minnesota, North Dakota, Wisconsin, and Nebraska and has grown to a staff of more than 300.
Visit www.srfconsulting.com